The 2023 Bank Run and Housing

March 16, 2023

The 2023 Bank Run and Housing

Housing Debrief graphic with market charts and a suited presenter.

Subscribe

The 2023 Bank Run & Housing, illustrated by a bank building standing on cracked ground.

Jerome Powell’s head is composited onto an armored knight among medieval warriors.

Line chart comparing federal funds rate increases across seven hiking cycles, with the 2022 cycle rising fastest.

A suited man watches a large red arrow shatter into pieces.

A blue sneaker presses a metal accelerator pedal inside a car.

Classical bank building standing on deeply cracked ground.

Graphic showing SVB, Silvergate, and Signature Bank logos over a cracked bank building.

Financial crisis

Mortgage originations by credit score, shown in stacked quarterly bars from 2003 to 2022, with orange arrows.

Liquidity graphic with overlapping stock market figures and charts.

Government bonds banner over a rising chart on a tablet.

Bank liquidity graphic compares government bond yields in February 2022 and March 2023.

People queue at four outdoor ATMs beneath a colorful floral panel.

Twitter

Bank Term Funding Program graphic featuring Federal Reserve, Treasury, and FDIC imagery.

Bank building on cracked ground beside a First Republic logo panel.

Jerome Powell’s head on a white dove with outstretched wings.

Black six-speed manual gear shift knob with metallic trim.

One-year U.S. 10-year Treasury yield chart, with orange arrows highlighting the March peak and latest 3.573% reading.

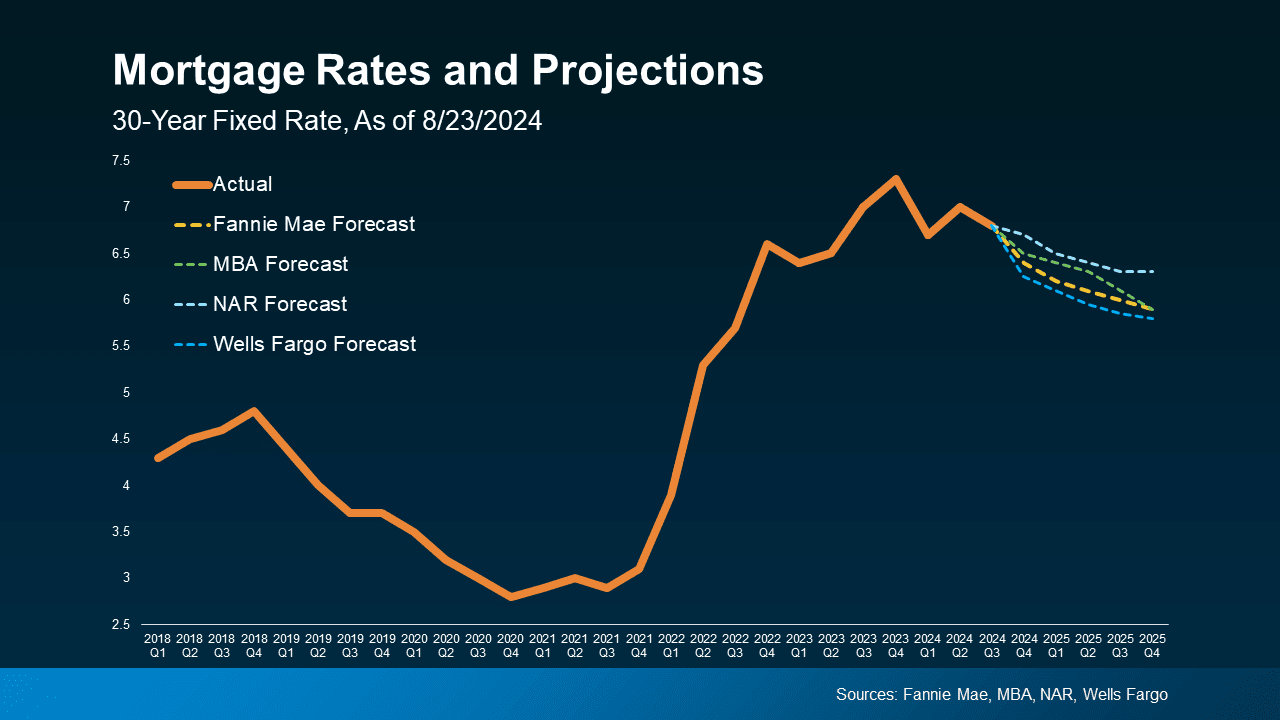
Mortgage rate chart from May 2022 to March 2023, highlighting a 6.54% rate.

Line chart of mortgage credit availability from 2004–2022, peaking above 800 in 2006 and ending at 102.5.

Hands support a glowing dashboard of financial charts and data symbols.

Miniature two-story house chained to a red FOR SALE tag

A house suspended over a chasm as two silhouetted people pull it in opposite directions.

Southern California active listing inventory chart with year-over-year trends and May 2022 comparison callouts.

Line chart of Southern California monthly new listings, highlighting 108,000 missing sellers.

Southern California pending-sales chart: 11,076 today, the lowest March level since tracking began in 2012.

Line chart comparing monthly expected market time from 2019 to 2023, with a callout highlighting 53 days.

Chart comparing Southern California expected market time by month, with current day counts for six counties.

A large group lines up on a lawn outside attached homes beside an open house sign.


Meeting attendees raise numbered cards in a bright, brick-walled room.

Housing Debrief graphic with “Want a Copy?” and a suited presenter over financial charts.

Visit ReportsOnHousing.com and subscribe to Reports on Housing.

Reports on Housing spread about Los Angeles County’s housing shortage, with a dripping faucet and inventory chart.

Graphic with a QR code, “COUPON,” and “Banks.”

Alan Mack, Mack Financial Services

Modern two-story house with a raised timber deck and a family standing outside

Mortgage loan options comparing jumbo products, rate-shopping, bank networks, and special financing programs.

Five Star Professional 2022 Market Leaders award for Alan Mack of Mack Financial Services.

Contact Alan Mack at Mack Financial Services for a low rate: (949) 929-1091.

Let's Talk

You’ve got questions and we can’t wait to answer them.