Orange County Housing Report: Rates Pave Path for Housing
February 20, 2023

February 20, 2023


Stay up to date on the latest real estate trends.
October 20, 2026
Celebrating our team's dedication to exceptional service, meaningful relationships, and a shared passion for Orange County real estate.

September 30, 2026
Why Today’s Housing Market Is Fundamentally Different From 2008
January 14, 2026
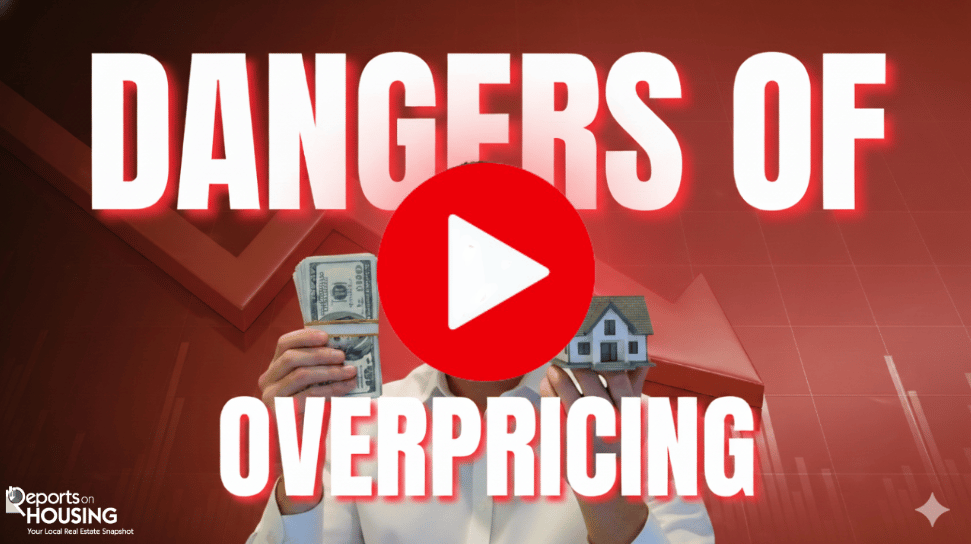
How to Price Your Home For A Faster Sale
September 10, 2024
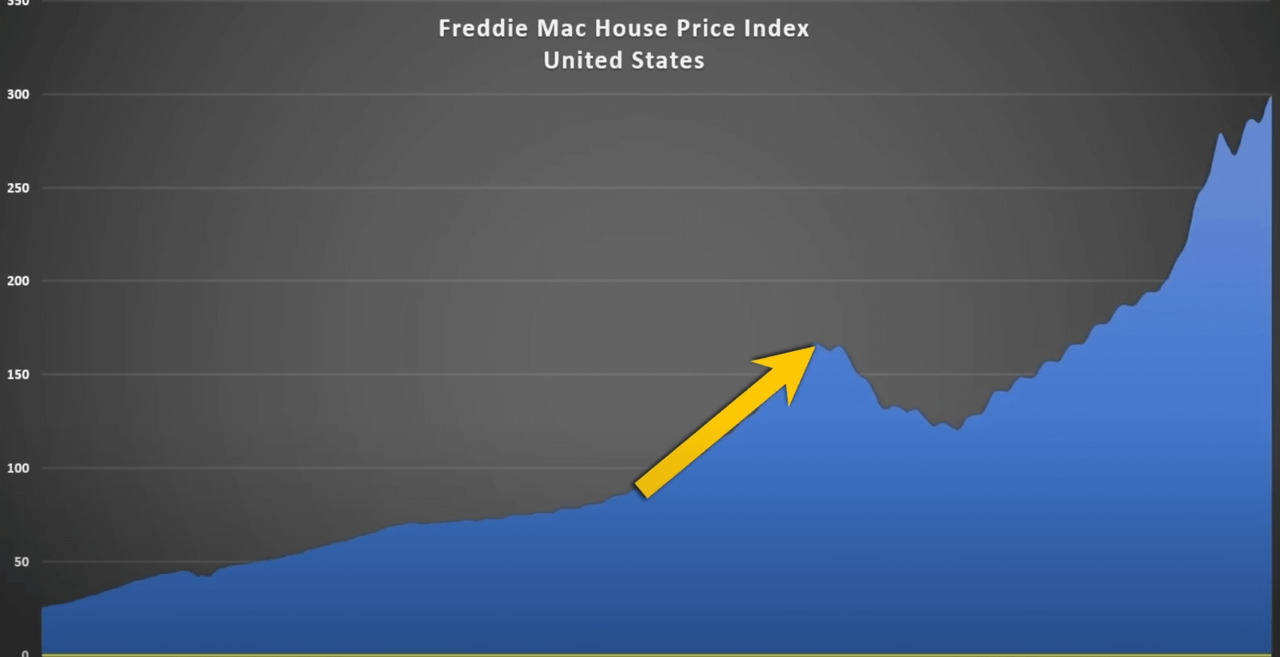
Navigating the Shifting Housing Market: No Crash in Sight
September 4, 2024
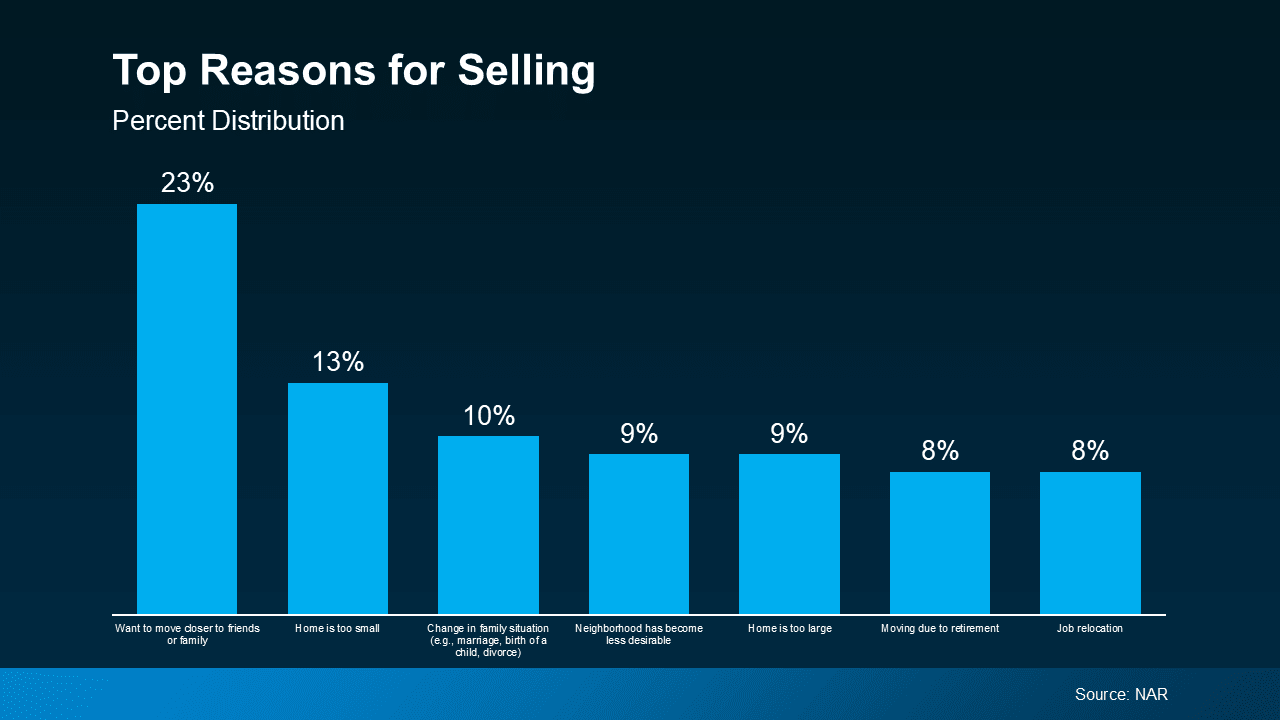
Understanding Why Homeowners Are Selling and How Rate Cuts May Boost the Market
September 4, 2024
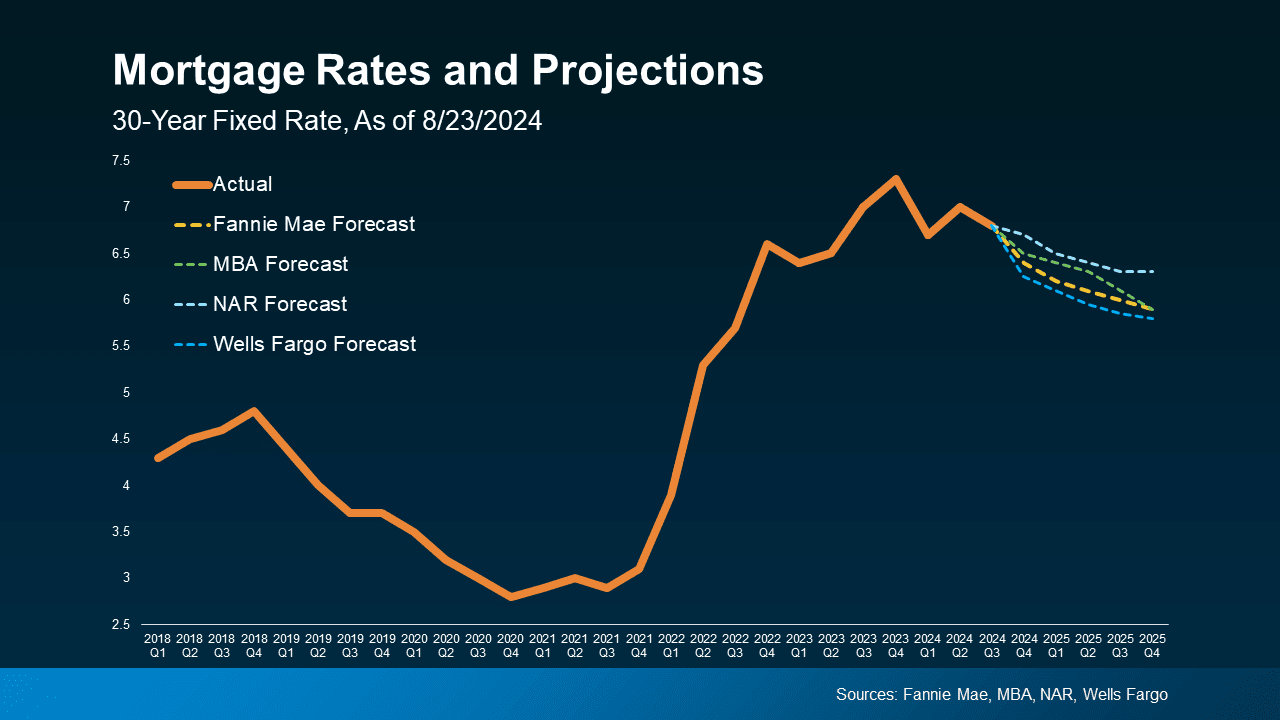
How Potential Federal Rate Cuts Could Bring Positive Shifts to the Housing Market
You’ve got questions and we can’t wait to answer them.