Housing Debrief 2023

April 25, 2023

Housing Debrief 2023

Housing Debrief graphic with financial charts and a suited presenter.

Graphic reading “Housing is Extremely HOT!!” above a hot housing market illustration.“NOPE!” above logos for major news and financial media outlets.

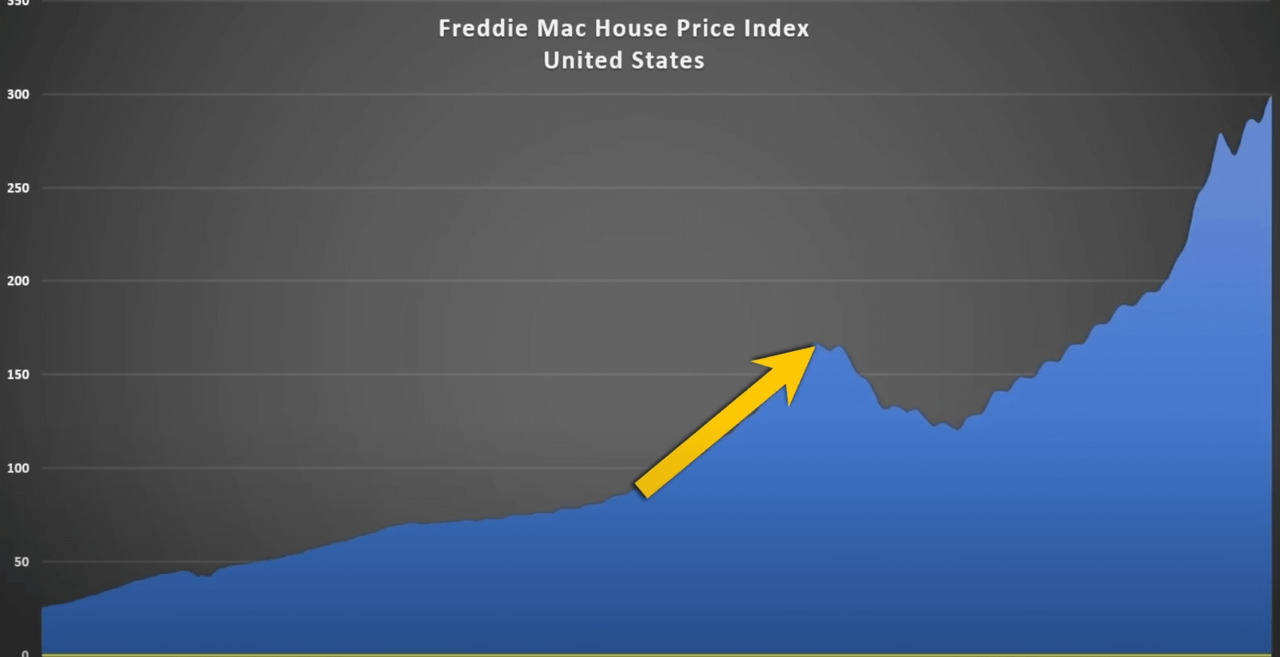
Spring inventory error graphic: inventory not found and unavailable in your area.Chart comparing weekly U.S. single-family home inventory by year, with 2023 inventory at 410,851.Chart of Southern California active listing inventory from 2012 to 2022, with an orange dashed benchmark and arrow.U.S. housing inventory chart, with arrows highlighting its 2007 peak and low at the right edge.

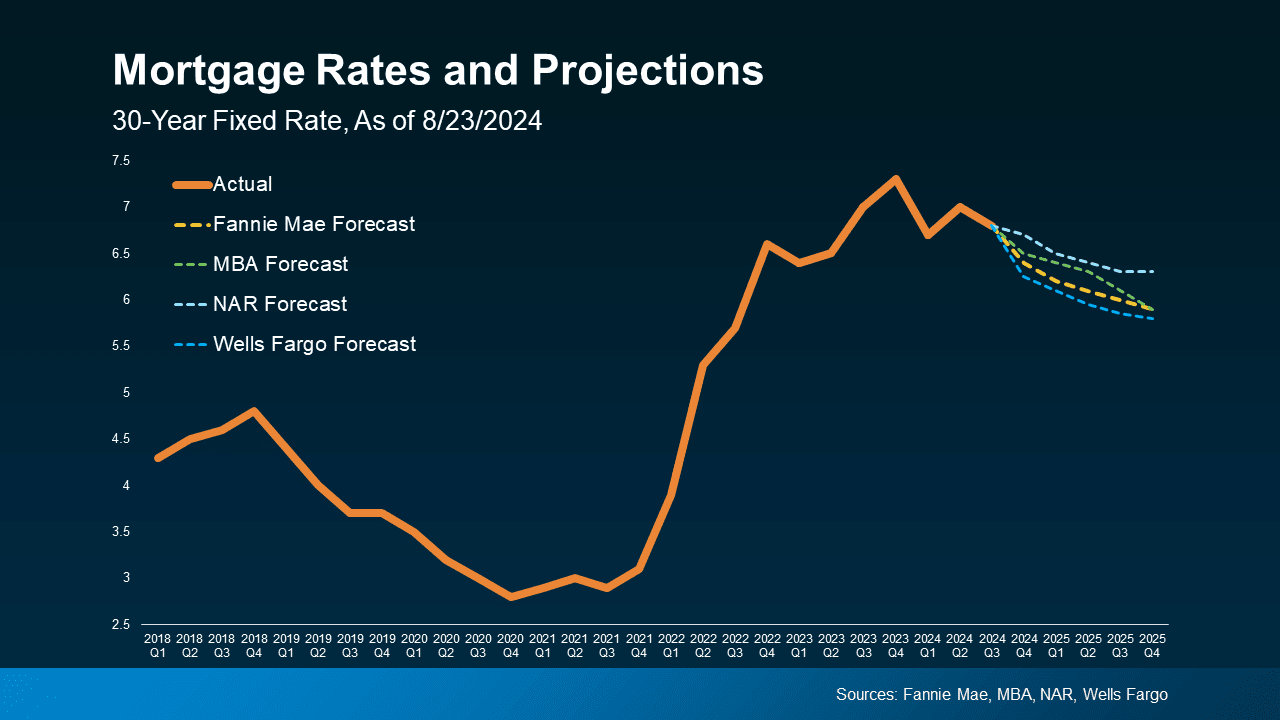
Chart of the 2020 U.S. population by age and generation, with an arrow pointing to the Millennials’ peak.Chart compares average real wealth by generation and age; an orange arrow points to Millennials/Gen Z near age 33.Mortgage rate chart from June 2022 to April 2023, ending at 6.67%.Chart of Southern California monthly new listings, 2015–2023, highlighting 108,000 missing sellers.Chart of Southern California monthly new listings versus the 2017–2019 average, highlighting 40,200 missing sellers.Bay Area monthly new listings chart comparing 2015–2023, highlighting 27,000 missing sellers.Bay Area monthly new-listings chart, with a late-2020 peak and an annotation highlighting 14,000 missing sellers.Chart compares Southern California monthly pending sales from 2019 to 2023, highlighting 11,900 today versus 16,052 last year.Hot housing market graphic with a house-shaped hot sign.Chart of Bay Area days of inventory, peaking above 80 in January 2023 before falling to about 40 in April.Chart of Southern California days of inventory from 2012 to 2023, with market-category thresholds.Chart comparing monthly expected market time from 2019 to 2023, with 2023 at 45 days in April.Chart comparing Southern California expected market time by month from 2019 to 2023, with hot and insane market ranges marked.Infographic listing days for housing markets in California and Phoenix beside a thermometer.People raise numbered cards at a real estate auction beneath a red FOR SALE sign.Housing Debrief graphic with a smiling man in a suit and financial charts.Reports on Housing banner directs visitors to ReportsOnHousing.com, with an arrow pointing to the Subscribe button.Orange County housing report spread titled “Housing Insanity Returns,” with a seller’s market analysis and chart.QR code beside the words “COUPON” and “HOT.”

Let's Talk

You’ve got questions and we can’t wait to answer them.